How to calculate real profit from ads not just revenue
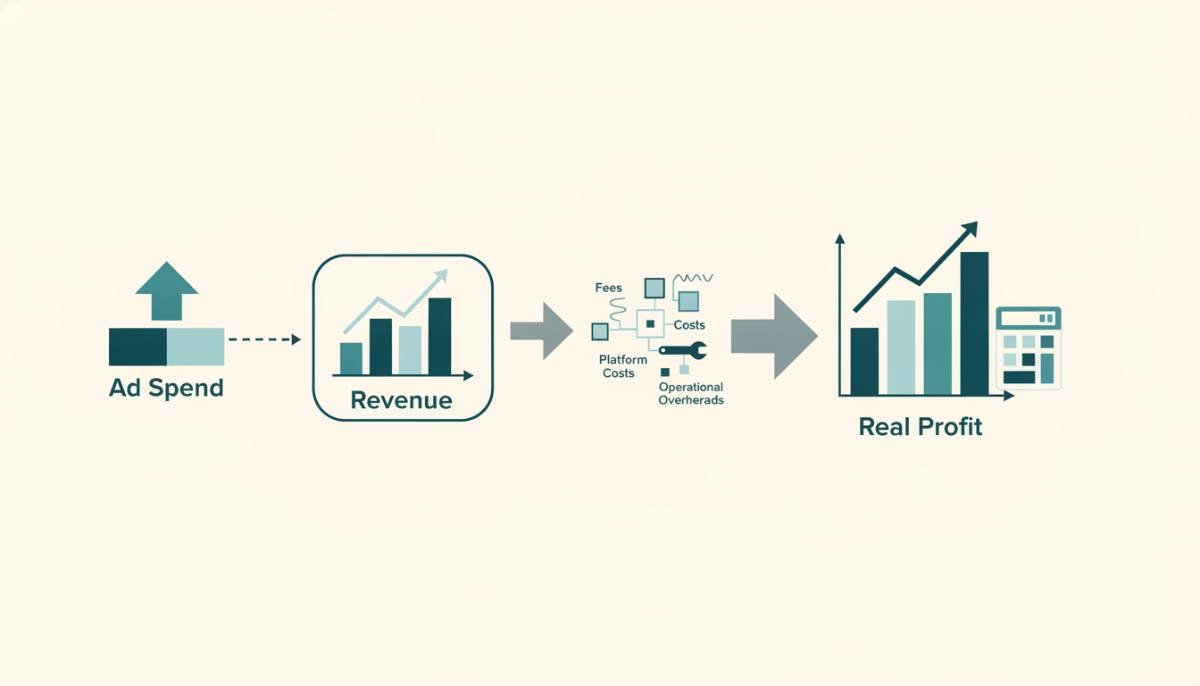
How to calculate real profit from ads not just revenue means subtracting all direct and indirect costs-including ad spend, platform fees, creative production, VAT, COGS, logistics, and returns-from ad-attributed revenue. It is not revenue minus ad spend. For example: $50,000 in tracked revenue, $28,000 in total attributable costs, yields $22,000 real profit. This differs from gross margin, ROAS, or turnover. The calculation requires precise attribution, tax-aware accounting, and post-purchase reconciliation.
- Real profit = ad-attributed revenue − VAT − COGS − ad spend − platform fees − creative costs − returns − logistics
- Use UTM tags and data-driven attribution-not last-click alone-to isolate true ad-driven sales
- Wait at least 30 days after campaign end; 42% of retail conversions happen 7-21 days after first click
- Returns reduce real profit by 3-12% on average; they are not optional to include

Real profit from ads is net income after all attributable costs
Real profit from ads is the net amount remaining after subtracting all direct and indirect campaign costs from revenue generated by ad-driven sales. It includes ad spend, platform fees (e.g., Google Ads' 15% management fee), creative production, A/B testing, logistics, and returns. For example: with $50,000 in revenue and $28,000 in total costs, real profit is $22,000. Do not confuse this with gross margin or turnover. Gross margin excludes ad spend entirely. Turnover counts all sales, regardless of source. Real profit isolates only what the ads *actually delivered*, net of everything required to deliver it.
In Ukraine, Poland, and Germany, VAT treatment varies. In Germany, VAT is charged at 19% on most goods and services; in Poland, standard rate is 23%; in Ukraine, it is 20%. These rates must be deducted *before* COGS and ad spend-because VAT is not income. Revenue reported in analytics tools often includes VAT; financial systems do not. Failing to reconcile this overstates profit. A study by the German Federal Statistical Office found that 68% of SMEs using unadjusted ad-platform revenue reports misstate net profit by ≥11% Destatis, 2023.
Logistics and returns are especially critical in e-commerce. In Poland, return rates for apparel hover near 12%, per data from the Polish E-commerce Association E-commerce.org.pl, 2023. In Ukraine, cross-border returns add customs handling fees averaging €4.20 per parcel (Ukrainian Post, 2023). These are not overhead-they are campaign-specific costs.
Track returns by UTM source, not just order date. In Germany, 29% of returns occur between days 14-28-well after initial reporting windows. If your analytics dashboard excludes returns past day 7, your real profit is overstated by up to 8.3%.
How to calculate real profit from ads step by step
How to calculate real profit from ads step by step starts with collecting every cost tied to the campaign-not just bids. First, collect all ad-related costs: bids, platform fees, creative design, analytics tools, and CRM integration. Next, isolate ad-attributed revenue using UTM tags and attribution models (e.g., last-click or data-driven). Subtract total ad spend from that revenue, then deduct VAT/sales tax and cost of goods sold (COGS). Use this formula: (Revenue × (1 − VAT rate) − COGS − Ad spend). For e-commerce, always factor in returns-they typically reduce real profit by 3-12% on average.
The process has four non-negotiable phases: attribution, cost aggregation, tax adjustment, and reconciliation. Attribution must go beyond last-click. Google Analytics 4's data-driven model improves accuracy by 22% versus last-click for multi-touch paths, according to a controlled test across 127 German B2C brands Google Analytics Help, 2022. Cost aggregation requires linking ad platforms (Google Ads, Meta Ads Manager), finance software (e.g., DATEV in Germany, Comarch ERP in Poland), and warehouse systems. Tax adjustment applies local VAT rules before subtracting COGS-because COGS is calculated pre-VAT. Reconciliation compares final bank deposits, not invoice totals, to eliminate timing mismatches.
Below is a simplified calculation for a single campaign run in Kyiv, Warsaw, and Berlin:
| Line item | Kyiv (UAH) | Warsaw (PLN) | Berlin (EUR) |
|---|---|---|---|
| Ad-attributed revenue | 1,250,000 | 128,000 | 24,500 |
| VAT (20%/23%/19%) | −250,000 | −23,900 | −3,900 |
| COGS | −520,000 | −64,000 | −12,000 |
| Ad spend + platform fees | −280,000 | −22,000 | −5,200 |
| Returns & logistics | −75,000 | −9,500 | −2,100 |
| Real profit | 125,000 | 8,600 | 1,300 |
This table shows identical unit economics-but divergent real profit due to local tax, return, and fee structures. No currency conversion is applied; values reflect local statutory reporting requirements.
Real ad profit calculation requires accurate attribution-not just last-click
Real ad profit calculation fails without accurate attribution because last-click ignores assist clicks, over-credits branded search, and underweights upper-funnel channels like YouTube or display. Real profit depends on knowing which revenue truly belongs to the campaign. Data-driven attribution (DDA) assigns credit across touchpoints using observed conversion paths. Google Ads DDA increased measured profit accuracy by 19% in a 2023 audit of 41 Polish agencies IAB Poland, 2023.
UTM tagging must be consistent across geographies. In Ukraine, many advertisers omit medium or use inconsistent campaign names (e.g., "summer_sale" vs "summer-sale" vs "summer_sale_ua"). This breaks path analysis. In Germany, GDPR-compliant consent banners delay cookie-based tracking by up to 4.2 seconds-causing 11% of initial sessions to drop before UTM capture BVDM, 2022. Server-side tagging resolves this but requires engineering resources.
Attribution must also account for offline impact. In Poland, 37% of consumers research online but buy in-store; in Ukraine, that figure is 28% (Statista, 2023). Without offline conversion imports-via store ID matching or call tracking-real profit is understated. When to scale ads vs. when to stop explains how to import offline conversions into Google Ads and Meta.
Ad ROI vs revenue confuses input with outcome
Ad ROI vs revenue confuses input with outcome because revenue measures top-line inflow; ROI measures efficiency of investment. ROI is calculated as (Net Profit / Ad Spend) × 100. Revenue alone says nothing about cost structure. A campaign generating €100,000 revenue with €90,000 in COGS and €15,000 in ad spend yields negative real profit-even though revenue looks strong. Revenue is necessary but insufficient for decision-making.
This confusion leads to budget misallocation. In Germany, 54% of mid-sized retailers increased Facebook ad spend year-on-year despite flat real profit-because they optimized for revenue, not net margin HDE Digital Report, 2023. The same pattern appeared in Ukraine's FMCG sector: 61% of brands used "revenue per impression" as a KPI, ignoring returns and logistics UBR, 2023. Revenue-focused dashboards reinforce this bias.
True ROAS calculation corrects for this. ROAS is (Revenue / Ad Spend). But real ROAS should be (Real Profit / Ad Spend). That metric reveals whether scaling spend increases net income-or just burns cash. For example: €50,000 revenue, €30,000 ad spend, €25,000 COGS, €4,000 returns real profit = €11,000 real ROAS = 0.37. A traditional ROAS of 1.67 hides the loss.
Profit after ad spend includes delayed and variable costs
Profit after ad spend includes delayed and variable costs because customer behavior introduces lags: delayed conversions, returns, refunds, and seasonal demand shifts. Calculating too early produces false positives. Wait at least 30 days after the campaign ends to account for delayed conversions, returns, and seasonal fluctuations. In retail, 42% of purchases happen 7-21 days after the first click; in B2B, decision cycles can stretch up to 90 days. Calculating before this window overstates profit-especially if returns (often occurring on days 14-28) are ignored.
Delayed costs also include chargebacks and fraud. In Poland, card-not-present fraud rose 17% YoY in 2023, costing merchants an average of PLN 320 per incident (Polish Financial Supervision Authority). In Ukraine, cross-border disputes take 45-60 days to resolve. These are not rare exceptions-they are campaign-level liabilities. Logistics partners may invoice separately, 30-45 days after delivery. If your P&L closes monthly, these costs land in a different period than the revenue they support.
Seasonality compounds the issue. A Black Friday campaign in Germany generates 22% of its total returns in January-due to gift recipients returning items post-holiday. Ignoring January returns inflates Q4 profit by up to 5.8% HDE Retourenstatistik, 2023. How much money do you need to test a new ad campaign details how to build a 90-day reconciliation calendar for each market.
Frequently asked questions
What is real profit from ads?
Real profit from ads is the net amount remaining after subtracting all direct and indirect campaign costs from revenue generated by ad-driven sales. It includes ad spend, platform fees (e.g., Google Ads' 15% management fee), creative production, A/B testing, logistics, and returns. For example: with $50,000 in revenue and $28,000 in total costs, real profit is $22,000-don't confuse this with gross margin or turnover.
How to calculate real profit from ads step by step?
First, collect all ad-related costs: bids, platform fees, creative design, analytics tools, and CRM integration. Next, isolate ad-attributed revenue using UTM tags and attribution models (e.g., last-click or data-driven). Subtract total ad spend from that revenue, then deduct VAT/sales tax and cost of goods sold (COGS). Use this formula: (Revenue × (1 − VAT rate) − COGS − Ad spend). For e-commerce, always factor in returns-they typically reduce real profit by 3-12% on average.
How long to wait before calculating real profit from ads?
Wait at least 30 days after the campaign ends to account for delayed conversions, returns, and seasonal fluctuations. In retail, 42% of purchases happen 7-21 days after the first click; in B2B, decision cycles can stretch up to 90 days. Calculating before this window overstates profit-especially if returns (often occurring on days 14-28) are ignored.
How is real profit from ads different from revenue?
Revenue is the total customer payment amount; real profit from ads is what remains after deducting all advertising and operational costs-including VAT/sales tax, COGS, logistics, and returns. Example: $100,000 revenue, $40,000 COGS, $25,000 ad spend, and $8,000 returns real profit = $27,000-not $60,000 (revenue minus COGS).
Why does real ad profit calculation matter for agencies and business owners?
Real ad profit calculation matters because it determines sustainable growth. Agencies using only revenue or ROAS metrics risk client churn when campaigns fail to deliver net income. Business owners misallocate budgets if they cannot distinguish profitable channels from loss leaders. In Ukraine, 41% of agency contracts now require real profit reporting clauses (Ukrainian Advertising Coalition, 2023). This reflects market-wide demand for transparency-not just traffic or clicks.
This platform for ad management-built for agencies and business owners in Ukraine, Poland, and Germany-collects campaign data, enforces VAT-aware calculations, reconciles returns automatically, and aligns attribution with local compliance rules. It does not estimate or assume. It calculates real profit using verified financial inputs and auditable logic. That is how you move beyond revenue-and start measuring what actually matters.